Facilities conducting industrial activities under certain Standard Industrial Classifications (SICs) are required to obtain National Pollutant Discharge Elimination System (NPDES) permits to discharge stormwater.
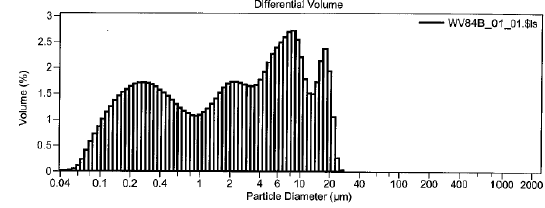
In the Pacific Northwest, these Industrial operations obtain permit coverage either under the Washington State Department of Ecology (Ecology) Industrial Stormwater General Permit (ISGP), or the Oregon Department of Environmental Quality (DEQ) 1200-Z Stormwater General Permit (1200-Z)*. These permits require sampling and analysis of stormwater discharges and contain some of the most stringent benchmark pollutant limits (benchmarks) in the country. The benchmarks for the heavy metals zinc and copper, shown in Table 1, are in micrograms per liter (µg/L), which is parts per billion, and thus it’s not surprising they often create the biggest challenge for industrial permittees.
 Upon exceeding a benchmark, diligent environmental health and safety managers will sweep their site, stop the leaks and drips, cover their dumpsters, get rid of the scrap pile, and if they happen to have these metals as part of their process, they’ll correct the obvious source – but many still exceed the benchmark levels. Sometimes the benchmarks are exceeded by only a small amount. What’s going on, and more importantly, what can be done? In helping to answer these questions, KJ has learned an essential early step is to understand what is in the stormwater, and has found that sometimes the solution lies in the tiny, tiny, details. Let’s take a closer look.
*For those of you in Oregon wondering, “what about the 1200-COLS permit?”, that permit expired 30 September 2016. DEQ will issue a bridge permit, the 1200-COLSB, until it can be combined with the new 1200-Z on or before 30 June 2017.
Particulate versus Dissolved
The zinc and copper benchmarks in the Washington and Oregon permits are for “total zinc” and “total copper”. The word “total” means that samples are collected in a bottle that contains a preservative, typically nitric acid, that keeps the metals in solution, and the analytical laboratory measures the total metals concentration in the sample. In contrast, an analytical laboratory can also analyze for dissolved metals only. In this case, “dissolved” means the laboratory filters the sample through a 0.45 micrometer (µm) filter and analyzes the portion of the sample that passes through the filter. That is, “dissolved metals” includes a measurement of metals in solution, and metals associated with very small particles. Samples for dissolved metals must be collected without preservatives, or the results will be inaccurate and misleading.
The analytical results from stormwater samples collected for both total and dissolved metals content provide one side of an equation that can help solve the stormwater problem. For example, if analytical results show a very low proportion of dissolved metals, a permittee may decide that implementing best management practices (BMPs) that target particulate removal may be worth trying. For a relatively small additional investment, a particle size distribution (PSD) analysis can provide another very helpful piece of information that can lead to a better understanding of the true nature of the stormwater problem.
Particle Size Distribution
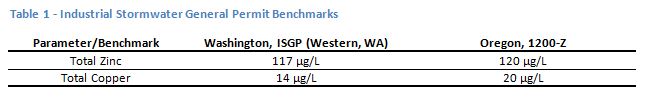
A PSD is a representation of the sizes of particles in a stormwater sample. The analysis can be done relatively inexpensively in an analytical laboratory, typically using laser diffraction on a specialized piece of equipment. An example of a graphical output from a PSD analysis for a typical stormwater sample from an industrial site is shown in Figure 1. The plot in Figure 1 is a graph of the particle diameters, in µm, on the x-axis and the percentage of the total volume of particulate in the sample for each of those diameter fractions. The resulting graph can be thought of as what it would look like if a person had sorted all the individual particles in the sample into very tiny bins ordered by size, and the height of the stack in each bin represents the amount of particles of that size in the sample.
The shape of the PSD plot points to the nature of the particulates and pollutants in the sample. The example in Figure 1 represents a sample with relatively high turbidity (a measure of cloudiness of water), and high total suspended solids, that also had a relatively low percentage of dissolved zinc. This is a site that might consider additional sweeping, or perhaps pavement repair. Note that the particles in this sample range from a size of about 0.2 micrometers (µm) for the smallest particles to about 40 µm for the largest. The smaller sizes, up to about 10 µm, are generally in the same size range as bacteria, and the larger sizes are generally in the size range of pollens. Most are smaller than the diameter of a human hair. These particle sizes can easily become and remain airborne. Stormwater treatment systems developed for capturing solids, such as hydrodynamic separators, are effective at removing particles down to only about 100 µm and would do little to improve the stormwater represented by these samples.
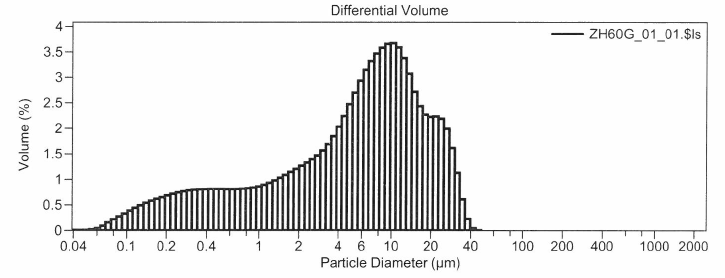
An example from a second site, the distribution in Figure 2, is for stormwater sample from a location that is frequently and effectively swept with a high-efficiency, regenerative-air, vacuum sweeper, but is still challenged with metals benchmark exceedances. Even the most effective high-efficiency sweepers can generally not remove particles below 8 µm, therefore for the site represented by Figure 2, a different approach is required.
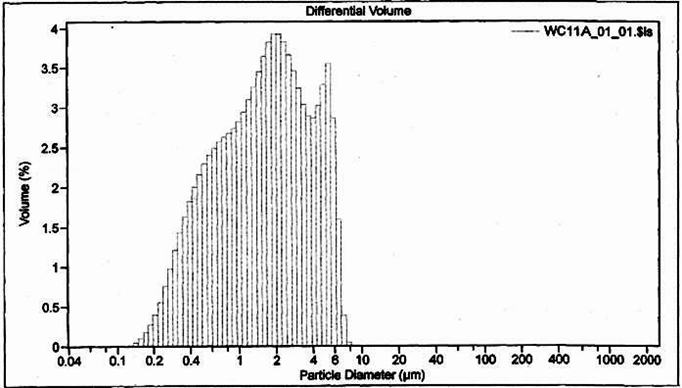
Finally, PSDs do not provide information about particle shape or density, which can also help with diagnosis of stormwater pollutant sources. This information can be obtained from microscopy, or it can be deduced from more conventional analyses. An example PSD from a third site is shown in Figure 3. This PSD also indicated stormwater with relatively large particles; however, samples from this site also generally had high turbidity but low total suspended solids. This information, combined with other knowledge of site operations, pointed to low-density particles, because larger, lower-density particles would tend to block more light than an equivalent mass of dense particles. These low-density particles were most likely rubber particles generated through tire wear, and would also be the most likely source of zinc. This knowledge helped guide the selection of appropriate BMPs to address the problem.
Subscribe Today
If you are interested in more information on Kennedy Jenks, don’t forget to subscribe to our blog!
